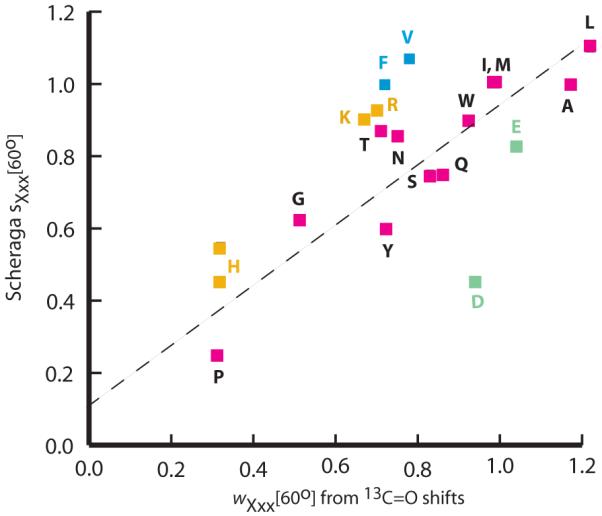
Figure 8.

A comparison of 60 °C helical propensity sets. The vertical axis plots Scheraga s values9c versus Figure 6 wXxx[T] values, horizontal axis. Vertical His and His+ values are both depicted; the Figure 6 His value was assigned at pH 7. The correlation coefficient for all residues is 0.68; it increase to 0.91 if data for F, V, and the charged residues are excluded.
