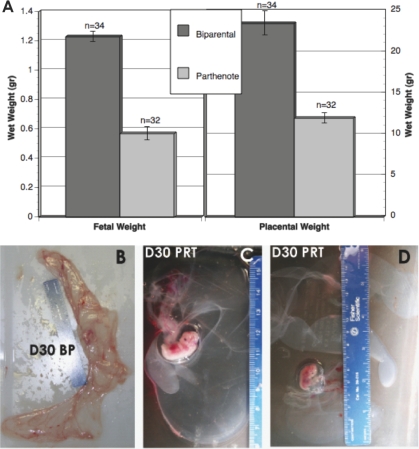
FIG. 1.
A) Fetal and placental weight comparisons between BP and PRT concepti at Day 30 of gestation. Bars indicate mean ± SEM; n indicates the number of observations. B–D) Gross morphology of placentae from Day 30 (D30) naturally mated (B) and PRT (C and D) gestations. Reduced vasculogenesis and angiogenesis are readily apparent in the swine PRT, compared with stage-matched BP controls. The PRT placental tissue often appears translucent, possibly resulting from ischemia, as would be expected from decreased oxygen transport. Ruler is in centimeters.

