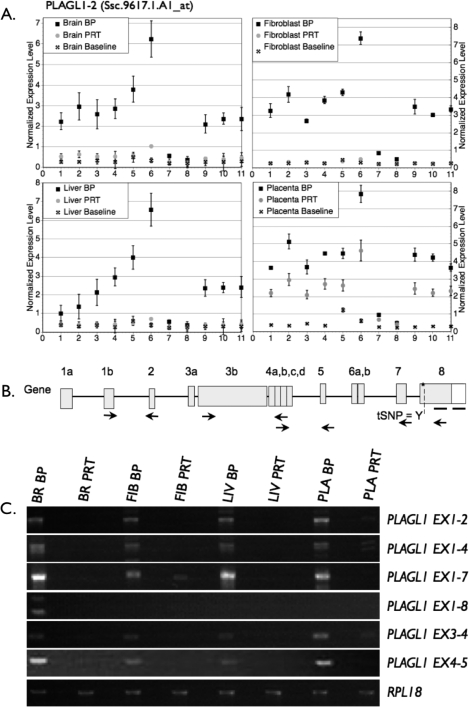
FIG. 5.
Analysis of expression at the PLAGL1 locus by isoform-specific semiquantitative PCR. A) PLAGL1 expression in two representative samples. Although pattern of expression in brain shows lack of expression in the PRT sample, in the placental sample there is significant PRT expression. As for DIRAS3, this supports the presence of a second isoform in the placenta compared with the other tissues. B) Diagram of the PLAGL1 gene and isoforms that have been detected in swine and/or humans. Locations of PCR primers are designated by arrows. The heavy bar indicates where array probes bind, and an asterisk/dashed line indicates tSNP for QUASEP. P1 and P2 represent alternative exon 1 expressed from promoter 1 or promoter 2 isoforms as identified in human studies. More than 50 PLAGL1 isoforms have been annotated by human/mouse expressed sequence tag databanks. The two depicted isoforms are representative of imprinted and nonimprinted isoforms as identified in human studies. C) The PCR results confirming the exon-by-exon microarray analysis, a pattern supportive of paternal expression. BR, brain; FIB, fibroblast; LIV, liver; PLA, placenta; Iso, mRNA isoform.

