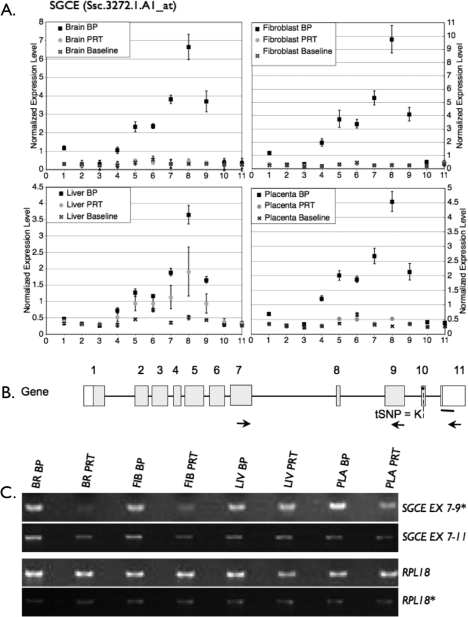
FIG. 6.
Analysis of expression at the SGCE locus by isoform-specific semiquantitative PCR. A) Expression of SGCE in BP and PRT tissues. Although there was expression of SGCE in the PRT liver, no PRT expression could be detected in any other tissue, including the brain. B) Schematic of SGCE gene and transcript isoforms that have been detected in swine and/or humans. Locations of PCR primers are designated by arrows. The heavy bar indicates where array probes bind, and an asterisk/dashed line indicates tSNP for QUASEP. C) The PCR results confirming the exon-by-exon microarray analysis, a pattern supportive of paternal expression. The asterisk is used to depict cDNA pools as described in Figure 2. BR, brain; FIB, fibroblast; LIV, liver; PLA, placenta; Iso, mRNA isoform.

