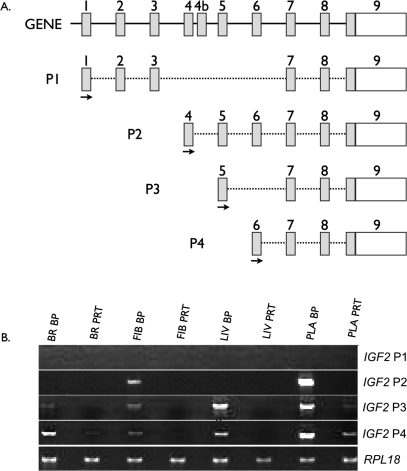
FIG. 8.
Analysis of expression at the IGF2 locus by isoform-specific semiquantitative PCR. A) Diagram of the different promoters/isoforms of IGF2 that have been detected in swine and/or humans. Locations of PCR primers are designated by arrows. B) The PCR results confirming the exon-by-exon microarray analysis (Table 3). Both sets of results confirm overexpression of the P2, P3, and P4 isoforms in the BP samples, a pattern supportive of paternal expression. BR, brain; FIB, fibroblast; LIV, liver; PLA, placenta.

