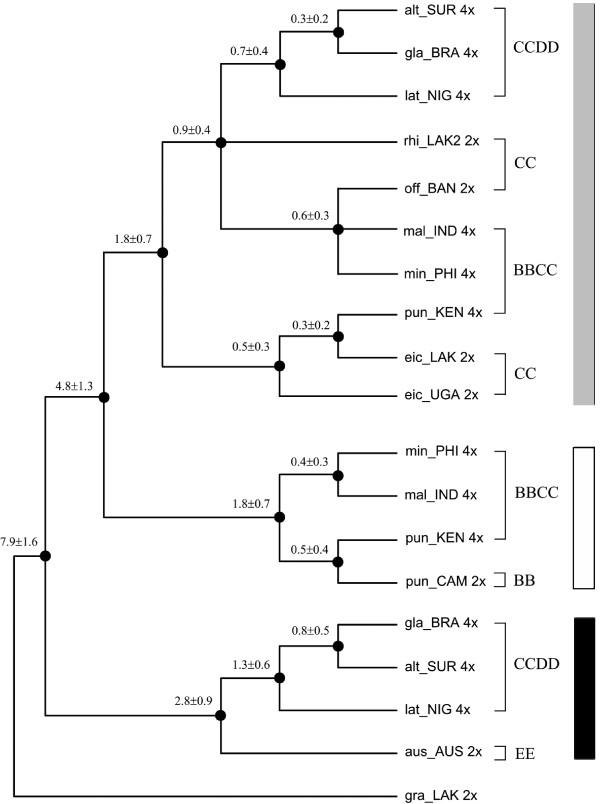
Figure 4.
Divergence times of main lineages in O. officinalis complex. Calculated by Bayesian relaxed-clock methods (details see Materials and Methods). Estimated Mya and the standard deviation were noted above the branches. 2×: diploid; 4×: tetraploid (Gray Square: C and C-like copy; White Square: B and B-like copy; Black Square: E and E-like copy).

