
Figure 5.
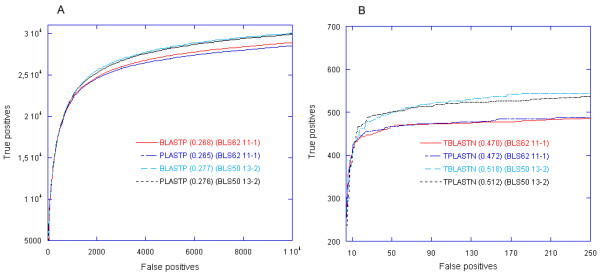
ROC curve. (A) The ROC curves for the SCOP/ASTRAL40 data set of PLASTP and BLASTP. (B) The ROC curves for the Yeast data set of TPLASTN and TBLASTN. The ROC10000 score in (A) and ROC250 score in (B) for each program are shown in parentheses after the program name.