
Figure 6.
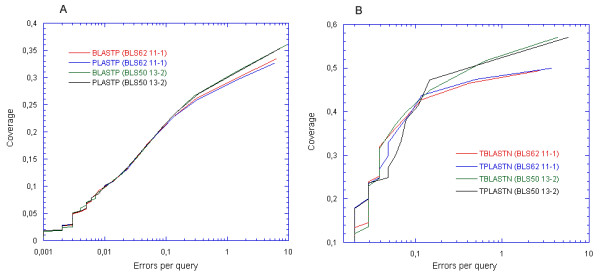
Coverage versus error plot. (A) The coverage versus error plots for the SCOP/ASTRAL40 data set of PLASTP and BLASTP. (B) The coverage versus error plots for the Yeast data set of TPLASTN and TBLASTN.
Official websites use .gov
A
.gov website belongs to an official
government organization in the United States.
Secure .gov websites use HTTPS
A lock (
) or https:// means you've safely
connected to the .gov website. Share sensitive
information only on official, secure websites.
Coverage versus error plot. (A) The coverage versus error plots for the SCOP/ASTRAL40 data set of PLASTP and BLASTP. (B) The coverage versus error plots for the Yeast data set of TPLASTN and TBLASTN.