
Figure 2. A-D: Confocal microscopy imaging of cav-1 in SSc skin.
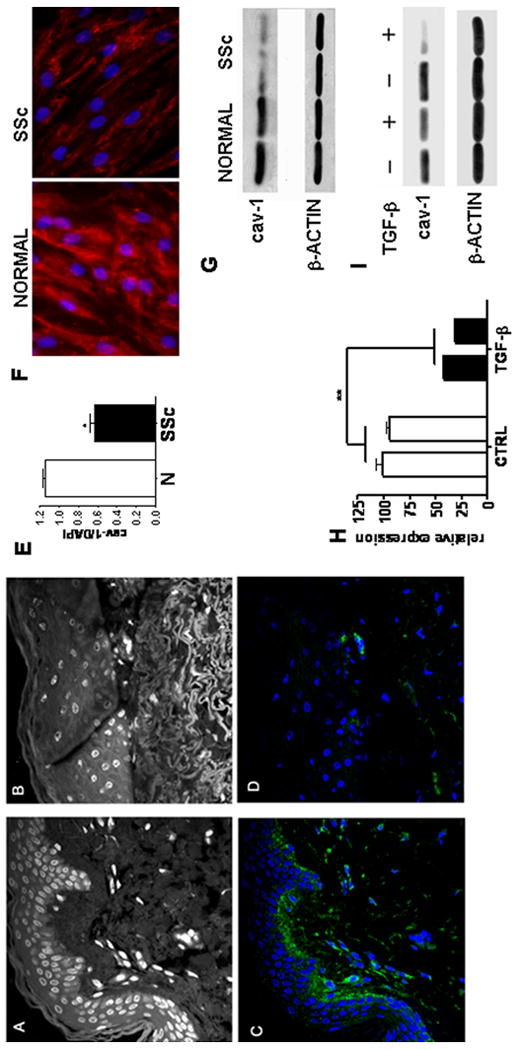
Non specific auto fluorescence of the DAPI channel is shown to display skin anatomy of (A) normal skin biopsy and (B) SSc skin biopsy. Note the tightly packed collagen fibrils in the lower dermis of the SSc biopsy. C: Confocal microscopy of the same section shown in A stained for cav-1 (green) and DAPI (Blue). Note the presence of intense cav-1 immunostaining surrounding almost every cell in the dermis. D: Same section shown in B stained for cav-1 (green) and DAPI (blue). Note that most cells (blue nuclei) do not show any detectable cav-1 staining (green) in their surface. The images shown in each panel are representative of tissue samples from three different patients. E: Quantitative analysis of fluorescence. Bar graph of the ratio between cav-1 and DAPI integrated density of fluorescence (IDF) in panels C and D. (*= p<0.05). F-G: Cav-1 expression in SSc fibroblasts in vitro. F: Immunofluorescence analysis of cav-1 expression (red) in confluent normal and SSc fibroblasts (both at passage 5). The figure shows a representative result from experiments performed with two normal and two SSc cell lines each in triplicate. Nuclei are stained with DAPI (Blue). G: Cell lysates from two SSc dermal fibroblast cell lines and two normal dermal fibroblast cell lines were analyzed by Western blot for cav-1. Antibodies directed against β-actin were used as control for equal protein loading. H-I: Cav-1 expression following TGF-β stimulation. H: mRNA levels for cav-1 were analyzed in two normal human fibroblast lines by real-time PCR following 24 h incubation with 10ng/ml TGF-β. Each bar represents the average ± SD of three different PCR. Cav-1 mRNA levels of the first line were arbitrarily set to 100 and all the other values calculated as multiples thereof. ** = p<0.01. I: Cell lysates from the same two human dermal fibroblast lines analyzed by Western blot for cav-1 following the same conditions described in panel H.