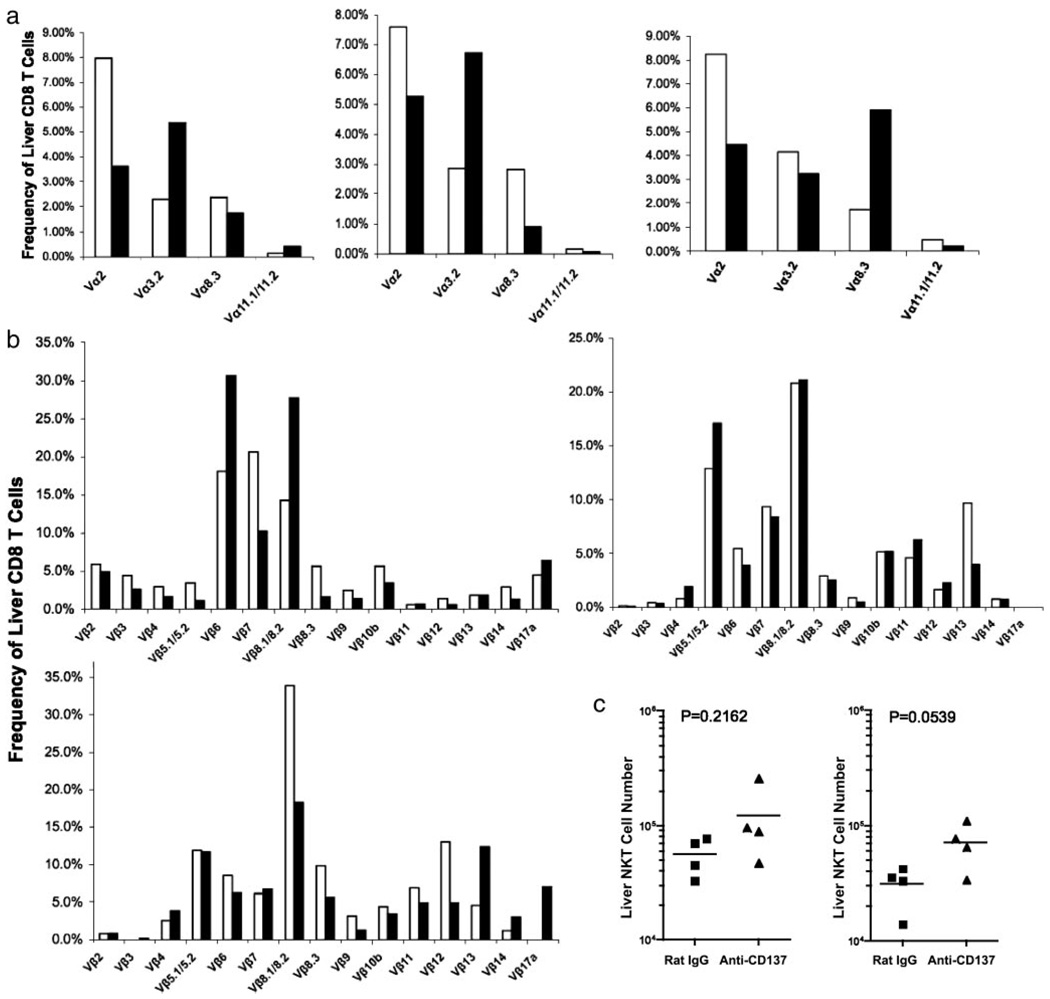
FIGURE 8.
TCR Vαβ usage by liver-infiltrating CD8 T cells and liver NK/NKT cells. a and b, TCR Vα and Vβ usage, respectively, by liver-infiltrating CD8 was determined in three separate experiments by staining CD8 T cells with fluorochrome-conjugated mAbs specific for individual Vαβ gene products, followed by FACS analysis 1 wk following the last of three weekly 200-µg injections of anti-CD137 or rat IgG. c, The absolute number of liver-infiltrating NK and NKT T cells was determined by flow cytometry following staining with anti-CD3 and NK1.1.

