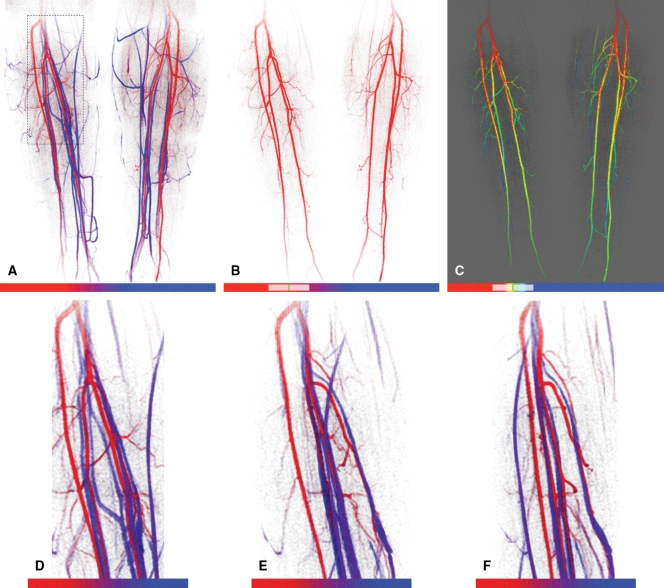
Figure 3:
TOA mapping from MR angiographic examination in Figure 2. A, Anterior projection of TOA map; TOA values of all pixels are subject to the opacity criterion described in text. Red-to-blue scale spans TOA values from frames 0–21 (0–113.4 seconds after contrast material injection). On color scales (bottom), hash marks indicate individual 5.4-second frame intervals. Color transition from red to blue occurs across frames 6–13. B, Anterior TOA map of anatomic region in A but with display limited to arrival times between frames 4.3 and 8.3 (23.2–44.8 seconds), as indicated schematically on color scale. This tends to limit display to major arterial vasculature in calves. C, Same limited extent of TOA values as in B but with color mapping adjusted from red only to red, green, and blue to better distinguish early versus late arrival times within 23.2–44.8-second range displayed. D–F, Magnifications of anatomic region at right popliteal trifurcation outlined by dashed rectangle in A, with same TOA color scale as in A. Images are shown as if viewed directly from anterior direction (0°) (A) and at 45° (B) and 80° (C) medially.

