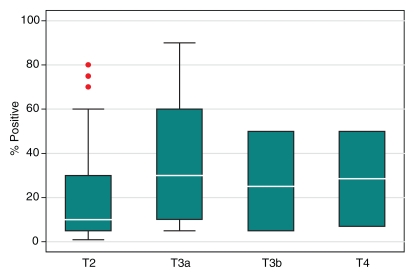
Figure 7b:
Graphs illustrate clinical variables, (a) prebiopsy PSA level and (b) maximal percentage of tumor in positive core-needle biopsy specimens, among patients with different pathologic stages of prostate cancer. White horizontal lines inside boxes indicate medians. Red dots indicate outlying values.

