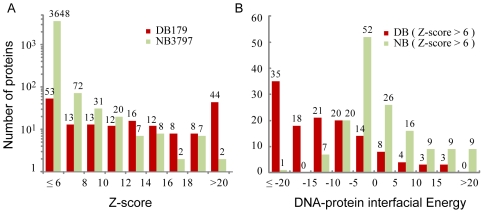
Figure 1. Properties selected for discriminating DNA-binding proteins from non-DNA-binding proteins.
(A) Fold similarity evaluated by the threading Z-score. For each target sequence from the DB179 and NB3797 sets, the highest Z-score obtained in threading was used to create the histograms. (B) DNA-binding propensity assessed by DNA-protein interaction energy. Only significant template hits with Z-score>6 were considered. For a target with multiple hits, the one with the lowest interfacial energy was chosen to create the histogram distributions.

