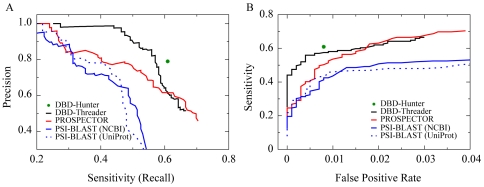
Figure 2. Comparison of methods for predicting DNA-binding function.
Benchmark tests were performed on DB179/NB3797 sets. (A) PR (Precision vs. sensitivity) curves. (B) ROC (sensitivity vs. FPR) curves. The curves of DBD-Threader were obtained by varying the energy threshold while requiring a minimum Z-score of 6. For PROSPECTOR and PSI-BLAST, the thresholds varied to calculate the ROC and PR curves are the threading Z-score of PROSPECTOR and the E-value of PSI-BLAST, respectively. If a target hits a template with a Z-score or E-value above the specified threshold, the target is predicted as DNA-binding and non-binding otherwise. The results from DBD-Hunter were obtained with optimized parameters [19] and the same template library as used by DBD-Threader.

