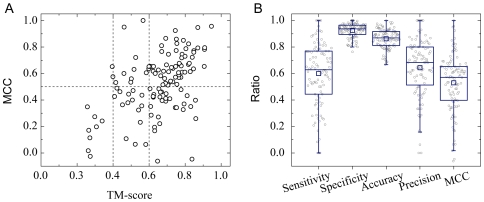
Figure 3. Predictions of structural models and DNA-binding sites.
A total of 100 DNA-binding proteins predicted by DBD-Threader were examined individually. (A) Scatter plot of TM-score versus MCC. Each point represents one of 124 predicted DNA-binding domains from the 100 DNA-binding proteins. (B) Box plots overlapped with data points are shown for five performance metrics on DNA-binding protein residue predictions. Each point represents one protein including all predicted domains. The lower, middle and upper quartiles of each box are the 25th, 50th, and 75th percentile; whiskers extend to a distance of up to 1.5 times the interquartile range. Data points and means are represented by circles and squares, respectively.

