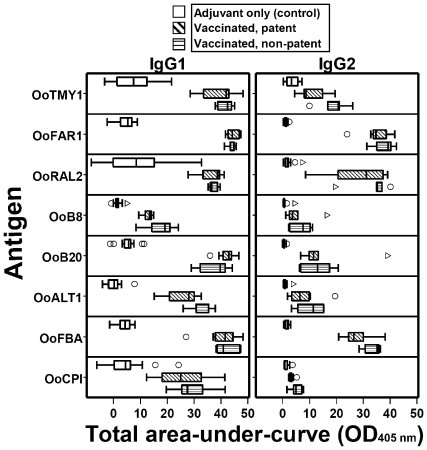
Figure 1. Total area-under-curve (OD405 nm) for IgG1 and IgG2 responses to eight Onchocerca ochengi recombinant antigens.
‘Vaccinated, patent’ (n = 7) or ‘vaccinated, non-patent’ (n = 5) refers to presence or absence of dermal microfilariae at 22 months post-exposure, respectively; all adjuvant-control animals had patent infections (n = 13). Area-under-curve was calculated from data obtained at 0, 4 and 21 months post-exposure. Box-and-whisker plots display the median line, 25th–75th IQR (box), highest and lowest values within 1.5× IQR (whiskers), outliers (○; >1.5–3.0×IQR) and extreme values (▹; >3.0×IQR).

