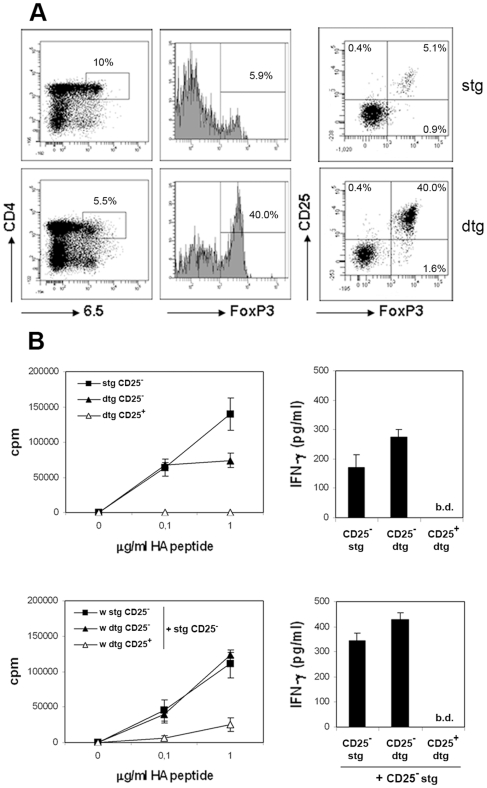
Figure 1. Tconv:Treg ratio and their proliferative capacity in stg and dtg mice.
(A) Cell suspensions obtained from the LNs of stg or dtg mice were stained for CD4, 6.5, CD25 and FoxP3 and analysed by flow cytometry. Living cells were gated for CD4 and 6.5 expression. One representative dot plot is shown. (B) LN cells from stg or dtg mice were stained and sorted by flow cytometry according to CD4, CD25 and 6.5 expression. 2.5×10⁴ sorted T cells were cultured in triplicate wells with 1.5×10⁴ DCs and different doses of HA peptide. After 70 h of coculture, supernatants were collected for IFNγ measurement and thymidine was added for an additional 16 h in order to measure proliferation (upper panels). In parallel, the ability of CD25− vs CD25+ dtg sorted cells to inhibit proliferation and IFNγ production of naive HA-specific T cells (stg CD25−) was analyzed (lower panels). Shown is one out of three independent experiments that gave similar results. b.d. = below detection.

