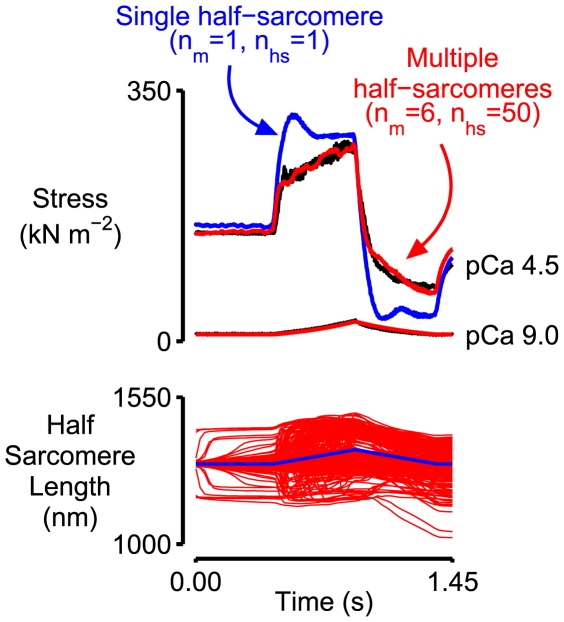
Figure 3. Simulated force and half-sarcomere length traces for the single and multi-half-sarcomere frameworks.
Top panel. The black lines in the top panel show the experimental force records for the pCa 9.0 and pCa 4.5 conditions from Fig 1. The red lines show the best-fitting force records for the framework containing 300 half-sarcomeres. The model parameters for this simulation are listed in Tables 1 and 2 (Column 3 in both cases). The blue lines show the simulated force records for a framework with a single half-sarcomere and otherwise identical parameters. Bottom panel. Half-sarcomere length traces for the multi-half-sarcomere (red) and single-half-sarcomere (blue) frameworks.

