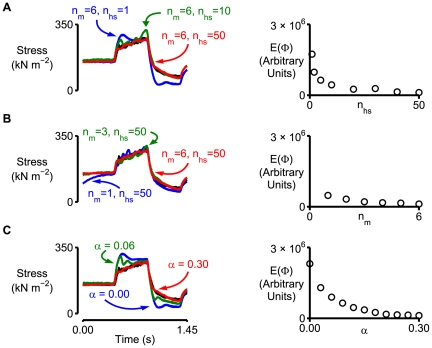
Figure 5. Effects of changing key model parameters.
Left hand panels show the experimental force record for the pCa 4.5 condition from Fig 1 in black and calculated force records from selected simulations in other colors. Right-hand panels show values of E(Φ) (Eq 10) for different simulations. Lower values of E(Φ) indicate that the simulated record fits the experimental data better. Unless otherwise stated, all simulations were performed using the model parameters listed in Tables 1 and 2 (Column 3 in both cases) and a model framework with n m = 6 and n hs = 50. A) Effect of increasing the number of half-sarcomeres (n hs) in each myofibril. B) Effect of changing the number of myofibrils (n m). C) Effect of changing the variance of the number of myosin heads per half-sarcomere (α, Eq 7).

