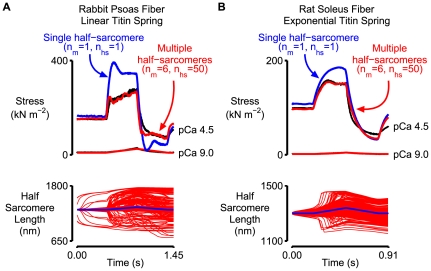
Figure 6. Additional simulations.
A) Rabbit psoas data from Fig 1 simulated with a linear passive component (Eq 9). B) Rat soleus data from Fig 4 of Campbell & Moss [14] simulated with a non-linear passive component. The top plots in both panels show experimental force records drawn in black, best-fit force records simulated with a multi-half-sarcomere framework in red and force records simulated using a single half-sarcomere framework and otherwise identical parameters in blue. The bottom panels show half-sarcomere length traces for the multi- and single half-sarcomere frameworks in red and blue respectively. Model parameters for both sets of simulations are listed in Tables 1 and 2.

