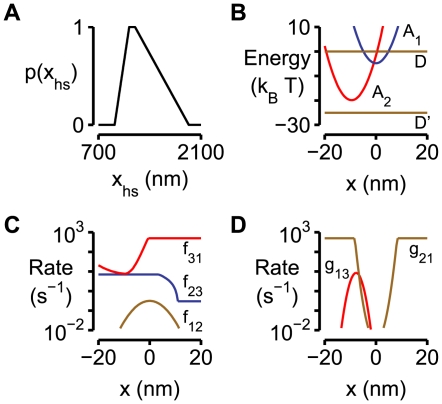
Figure 8. Assumptions underlying the calculations of Fact values.
A) p(x hs), the proportion of myosin heads that could participate in the cross-bridge cycle in a given half-sarcomere varied as a function of the half-sarcomere length as described in Eq 3. B, C, D) Plots showing the strain-dependence of the (B) free energy diagram (Eq 4), (C) forward rate functions (Eq 5) and (D) reverse rate functions (Eq 6) for the parameter values listed in Table 2 for the simulations of rabbit psoas fiber data with a non-linear passive component.

