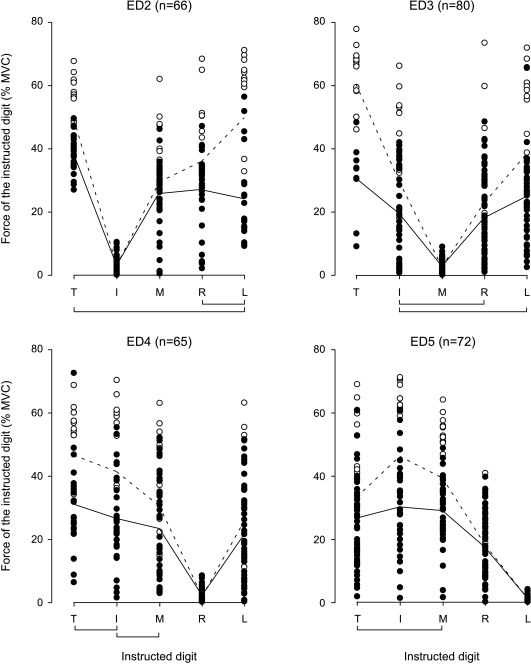
Figure 4. Force at the time of motor unit recruitment for each digital compartment of ED.
The four panels show all test motor units at their motor unit recruitment force produced by the other digits for a particular compartment of ED. The filled circles represent the actual recruitment thresholds of the motor units that were recruited. The open circles represent the estimated recruitment thresholds of the motor units that were not recruited during the extension ramp contractions of the instructed digits. These values were estimated as the average peak ramp force of that digit plus 10% MVC (see Methods). The continuous lines join the mean recruitment threshold of the motor units that were recruited by the test digits. The dashed lines represent the estimated mean recruitment thresholds of all motor units, including the non-recruited units. The lines below the plots link the digits of which the average force at time of recruitment of all test motor units (including the estimated values of the non-recruited motor units) was not different (P > 0.05).

