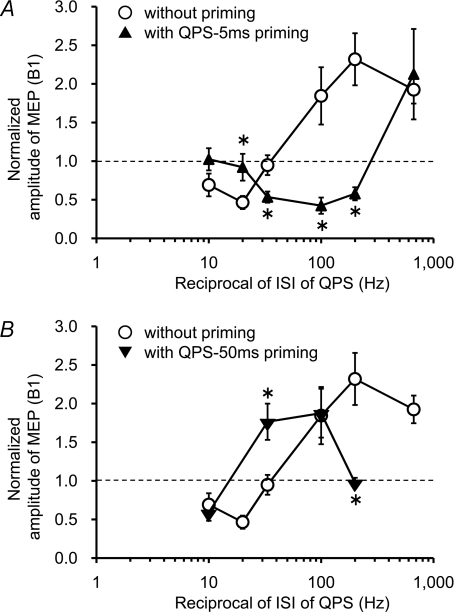
Figure 5. Priming-induced shifts in the stimulus–response function.
The normalized amplitudes of MEP at 30 min post conditioning as a function of the reciprocal of ISI of QPS with and without priming over SMA (○). A, QPS-5 ms priming (▴). B, QPS-50 ms priming (▾). Note that the x-axis is logarithmic axis. *P < 0.05 by post hoc paired t tests.

