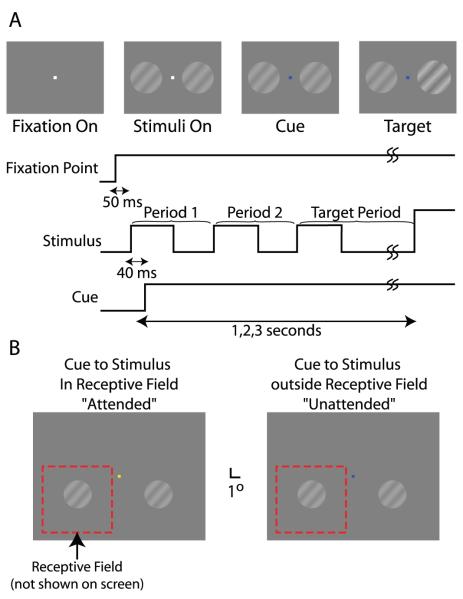
Figure 1. Trial Layout.
(A) The temporal layout of a single experimental trial. First, a white fixation cursor appears. After the monkey fixates the cursor for 50 ms, two grating stimuli appear on the screen. The gratings flash at 2.1 Hz in an appearance-disappearance fashion for the duration of the trial. 40 ms after the initial appearance of the visual stimuli, the fixation cursor changes color to indicate that the trial has started. After a variable delay, one of the two grating stimuli increases in contrast. If the monkey releases a bar within 1 s of the target appearance, the monkey is rewarded.
(B) A typical example of the relationship between the visual stimuli, the fixation cursor, and the receptive field of a recorded neuron is shown. Blocks of 12 trials share the same cue, which is indicated by the color of the cursor. If the cursor becomes yellow, the left grating is most likely to be the target. If the cursor becomes blue, the right grating is most likely to be the target. The dotted red box indicates the receptive field of the neuron schematically; the boundary is not actually drawn on the screen. The size and location of the grating patch are those that elicit the largest response to a 100% contrast grating.

