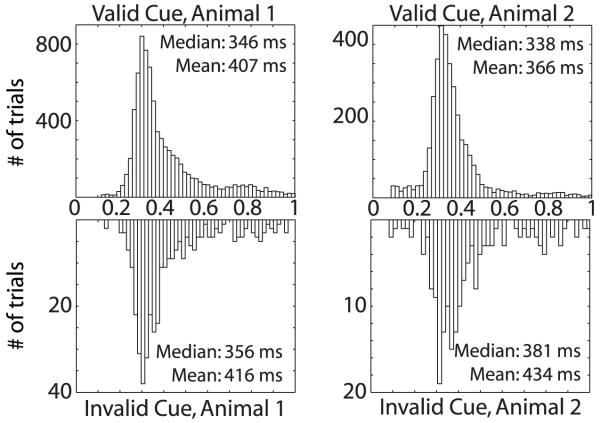
Figure 2. Reaction Time Distributions by Cue Condition.
Data from correctly performed trials are plotted. Responses to validly cued trials are in the upper histogram, responses to invalidly cued trials are in the lower histogram. While Animal 1 does not show a significant shift in median reaction time (ΔRTmedian = 10ms, P<0.46, Wilcoxon Rank Sum Test), Animal 2 shows a significantly slower reaction time in invalidly cued trials (ΔRTmedian = 43 ms, P<0.001, Wilcoxon Rank Sum Test). This figure is generated from the behavior during recording sessions for the neurons included in this report.

