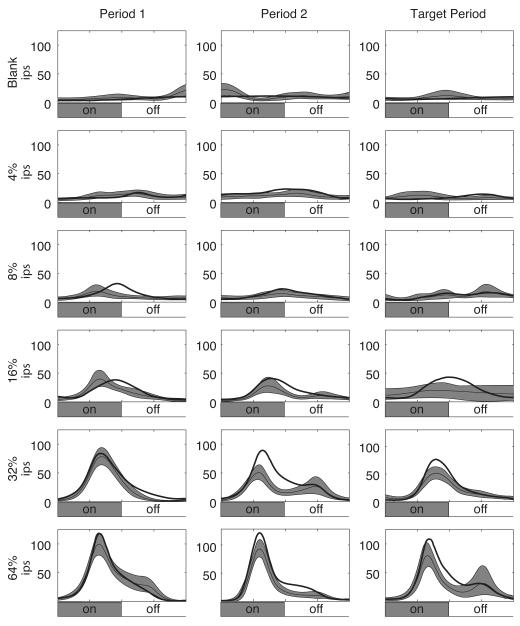
Figure 4. Example single unit ring rate response.
Correct trials are plotted from a well-isolated single unit recorded in V4. Each row of plots corresponds to a single stimulus contrast, indicated along the left margin. The left column contains responses from Period 1, the center column contains responses from Period 2, and the right column contains responses from the Target Period. Firing rates are calculated as local regression estimates: the thick line indicates the attended firing rate, the thin line indicates the unattended firing rate, and the shaded region indicates the jackknifed 95% confidence limits for the unattended firing rate. Vertical scale is in impulses per second (ips).

