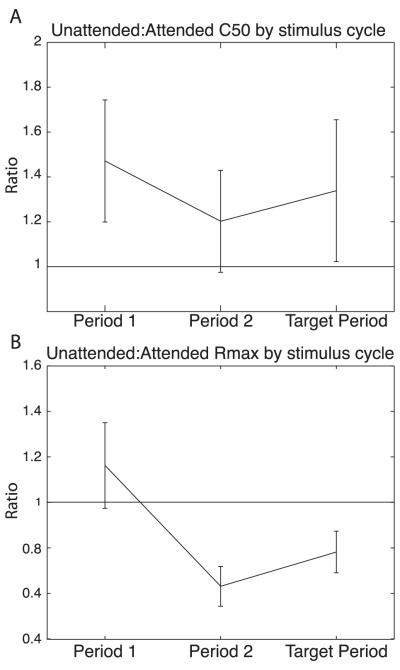
Figure 8. Progression of contrast gain and response gain across the stimulus cycles of the task.
(A) Ratios of C50 values across three stimulus cycles, Period 1 (left), Period 2 (middle), Target Period (right). The C50 values were obtained by fitting the CRFs with Eq. 1 with all parameters restricted to fit each condition of time-period and attentional cue separately. The ratio is formed between the C50 values for the Unattended responses and the values for the Attended responses. The mean ratio is plotted for each stimulus cycle (time-period) as is the 95% confidence interval for the mean.
(B) Ratios of Rmax values across three stimulus cycles. The Rmax values were obtained by separate fits of Eq. 1 to each time-period and cue condition. For each neuron, the Rmax value for the Eq. 1 fit to the Unattended CRF is divided by the Rmax value for the Eq. 1 fit to the Attended CRF. The mean of the ratios for all the neurons and the 95% confidence interval for the mean are plotted for Period 1 (left), Period 2 (middle) and Target Period (right).

