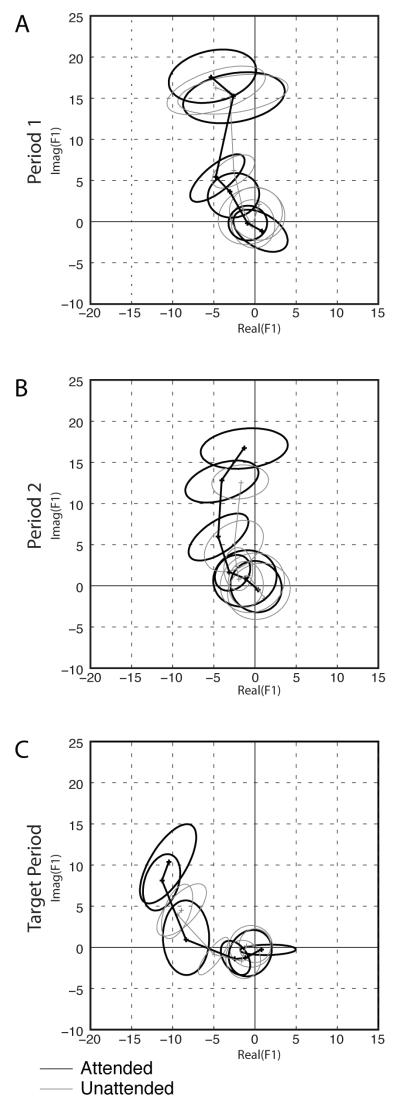
Figure 9. Example of F1 Responses.
(A-C) F1 contrast response function plotted for three different time periods. The F1 component at each contrast is plotted as a number in the complex plane. The responses to neighboring contrasts are connected by line segments. Panel A (“Period 1”) is the response to the first stimulus presentation, Panel B (“Period 2”) is the response to the second stimulus presentation, and Panel C (“Target Period”) is the response to all subsequent presentations. Targets could only appear in the “Target Period” condition. Ellipses denote bootstrap 95% confidence areas. The attended condition is plotted in black, the unattended condition in gray.

