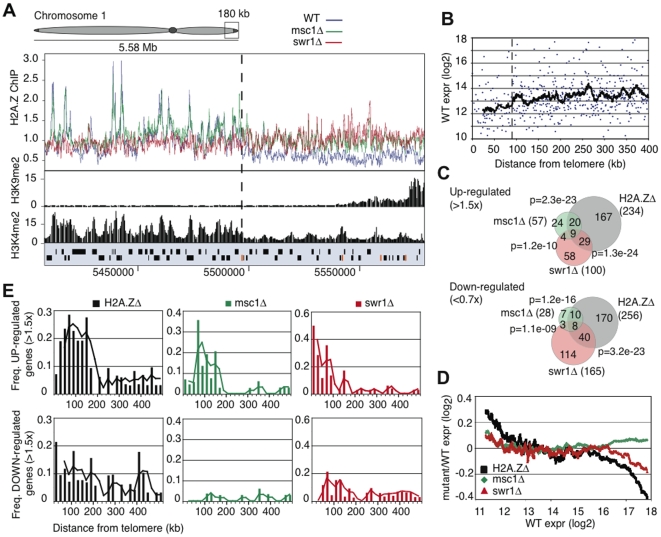
Figure 5. Msc1 is required for gene silencing in sub-telomeres.
(A) ChIP-chip binding profiles for H2A.Z-myc, H3K9me2, and H3K4me2 [53] for 180kb at the end of chromosome 1. Open reading frames are represented by black boxes and LTR retrotransposon elements by orange boxes. The dotted lines indicates the transition point between eu- and ST-chromatin domains. (B) Absolute RNA level in WT (log2) plotted against distance from nearest telomere for all genes in the fission yeast genome within 400 kb of telomeres on chromosomes 1 and 2 using data from Wiren et al, 2005 [52]. The black line represents a 20 gene moving average. The dotted line represents a transition point in gene expression approximately 90 kb from telomere ends. (C) Venn diagrams represent the number of genes either up (>1.5×) or down (<0.7×) regulated in H2A.ZΔ, msc1Δ or swr1Δ and the overlap between the three datasets. (D) Changes in RNA level over WT (log2 ratio) in each of the three mutants (H2A.ZΔ, msc1Δ or swr1Δ) were plotted as a moving average against WT RNA level. (E) Changes in RNA level over WT (log2 ratio) were plotted against genomic distance from the nearest telomere. Genes were grouped into 20 kb windows and the frequency of up- and down-regulated genes calculated for each 20 kb window.

