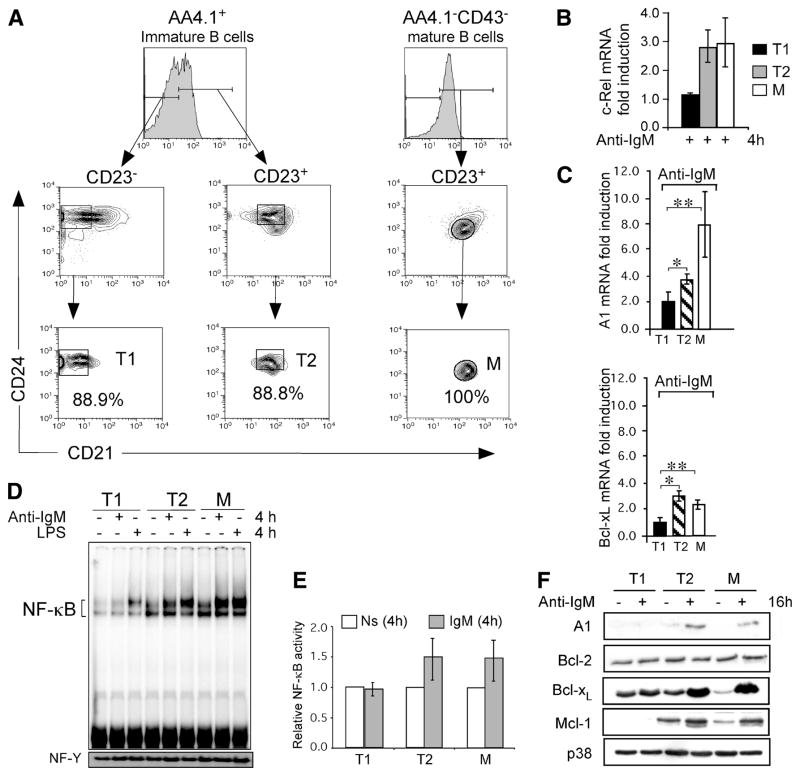
FIGURE 2.
BCR signaling induces cRel and anti-apoptotic genes preferentially in T2 and mature B cells. A, Purification of T1, T2 (CD21int-T2), and mature Fo B cell populations. Freshly isolated splenocytes from 4-wk-old C57BL/6 mice were depleted of RBCs. T1 and T2 B cells were obtained by MACS enrichment of AA4.1+ transitional B cells, followed by FACS purification using Abs directed against CD23, CD24 and CD21 to sort AA4.1+C23−CD24+CD21low (T1) and AA4.1+ CD23+CD24+CD21+ (T2) B cells. T2-PreMZ (AA4.1+C23+CD24+CD21high) B cell subset was excluded from sorted T1 and T2 B cells. Thus, the T1 and T2 B cells we have used here have previously been described by Hoek et al. and Meyer-Bahlburg (3, 4). The purity of T1 and for T2 was determined by postsort FCM analysis. Mature Fo B cells were MACS enriched from the AA4.1 negative fraction by CD43 depletion followed by FACS purification using the same Ab scheme as for T1 and T2 sorts; AA4.1−CD23+CD24lowCD21+ (Fo B). The purity of the mature Fo B cells was determined by postsort FCM analysis. B, Analysis of BCR-induced steady-state levels of c-Rel mRNA in FACS-purified T1, T2, and mature Fo B cells from C57BL6 mice. Cells were stimulated with 10 μg/ml anti-IgM F(ab′)2 for 4 h and analyzed for c-Rel mRNA by qRT-PCR. Relative fold levels of c-Rel was normalized to 18S and calibrated to the nonstimulated sample for each population. Data are mean with SD of five experiments using five to ten mice as a source of B cells for cell sorting. *, p = 0.0036; **, p = 0.0103. Levels of c-Rel protein in freshly isolated T1, T2, and mature B cells were similar (data not shown). C and D, Expression profile of NF-κB dependent A1 and Bcl-xL genes in transitional and mature Fo B cells. mRNA levels for A1 and Bcl-xL were determined by qRT-PCR in T1, T2 and mature Fo (M) B cells stimulated with 10 μg/ml anti-IgM F(ab′)2 for 4 h. Relative fold expression of each gene was normalized to 18S and calibrated to the nonstimulated sample for each population. Data are mean with SD of five experiments using five to ten mice as a source of B cells for FACS sorting as described in A. p values for A1 gene in anti-IgM treated samples; *, p = 0.051; **, p = 0.047. p values for Bcl-xL gene in anti-IgM treated samples; *, p = ≪0.000; **, p = 0.0024. D, Increased BCR-induced NF-κB DNA binding activity in T2 and mature Fo B cells relative to T1 cells. EMSA analysis for NF-κB DNA binding activity in FACS-sorted T1, T2, and mature Fo B (M) cells following stimulation with anti-IgM F(ab′)2 or 5 mg/ml LPS (as a positive control) or left nonstimulated. Equal amounts (2.0 μg) of nuclear extracts per lane were used in each DNA binding reaction. The NF-Y band was used as loading control. These experiments are representative of three independent experiments using five to ten mice as a source of B cells for FACS sorting. E, Fold change for total NF-κB activity from D normalized to NF-Y and calibrated to the nonstimulated sample. F, Cytoplasmic extracts were prepared from equivalent number of cells (1 × 10⁶) and analyzed by immunoblotting for A1, Bcl-2, Bcl-xL, and Mcl-1. Blot was stripped and probed for A1, Bcl-2, Bcl-xL, Mcl-1, and anti-p38 sequentially as a loading control. Data are representative of at least three experiments.

