FIGURE 3.
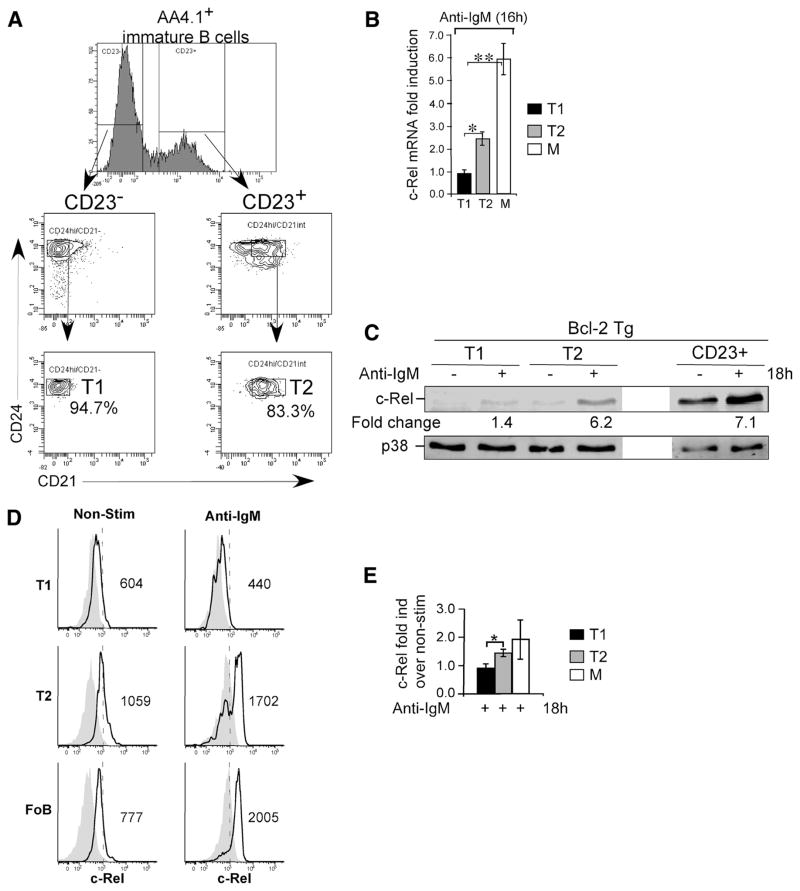
BCR signaling induces sustained c-Rel expression in T2 and mature, but not in T1 B cells. A, Purification of T1, T2, and mature CD23+ B cell populations by FACS. Splenocytes from six to eight spleens from 7- to 12-wk-old Bcl-2 Tg mice were depleted of RBCs. T1 and T2 B cells were obtained by MACS enrichment of AA4.1+ transitional B cells, followed by FACS-sorting as described in Fig. 2A. B, Analysis of BCR-induced steady state levels of c-Rel mRNA in FACS-purified T1, T2, and mature B cells from Bcl-2 Tg mice. Cells were stimulated with 10 μg/ml anti-IgM F(ab′)2 for 16 h and analyzed for c-Rel mRNA by qRT-PCR. Relative fold levels of c-Rel was normalized to GAPDH and calibrated to the nonstimulated sample for each population. *, p = 0.0279; **, p = 0.0043. Data are mean with SD calculated from five experiments using five to ten mice as a source of B cells for cell sorting. C, BCR signaling induces accumulation c-Rel in T2 and follicular mature B cells (CD23+) but not in T1 B cells. Immunoblot analysis of total cellular extracts from FACS-sorted T1, T2, and mature CD23+ B cells from Bcl-2 transgenic mice following stimulation with anti-IgM F(ab′)2 for 16 h. Blot was probed sequentially with anti-cRel and –p38 Abs and fluorescently labeled secondary Abs. Data were collected and quantified by Odyssey. Data are representative of three experiments. D, FCM analysis of c-Rel expression in MACS enriched splenic B cells after 16 h culture with or without anti-IgM F(ab′)2 (10 μg/ml) Abs. Cells were stained for B cell subset identification (T1, T2, and mature Fo B cells) as in A, fixed, permeabilized, and intracellularly labeled with Abs against c-Rel as described in Materials and Methods. c-Rel levels in nonstimulated and stimulated cells (open solid line histograms) and competition with unlabeled anti-c-Rel Abs (filled gray histograms) are shown for each splenic B cell subset. Data are displayed as mean fluorescence intensity (MFI). E, Fold change for c-Rel protein levels over nonstimulated samples from D and two additional experiments. *, p = 0.05.

