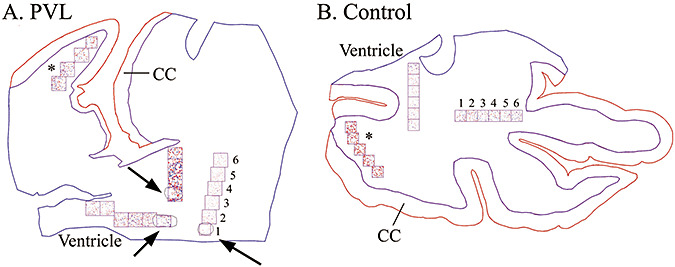
Figure 1.

Neurolucida images of Olig2 cell density analysis in a 40 post‐conceptional (PC) week periventricular leukomalacia (PVL) case (A) and a 40 PC week control case (B) (identical counting methods were used for caspase‐3 and Ki67). At low power (20×) the boundaries of the white matter (in blue) and the cerebral cortex (CC) (in red) were outlined. A boundary was then drawn around each necrotic focus (arrows; A). Using a grid system of six 1 mm2 boxes (where possible), with the first box placed over the PVL focus and subsequent boxes progressing away from it, Olig2‐immunopositive cells were counted using pre‐selected markers (at 200×). If more than one necrotic focus was found within each tissue section, a separate analysis was performed, hence the different markers used for each grid system. Analysis of Olig2 cell density was also performed in the distant intragyral white matter (*).
