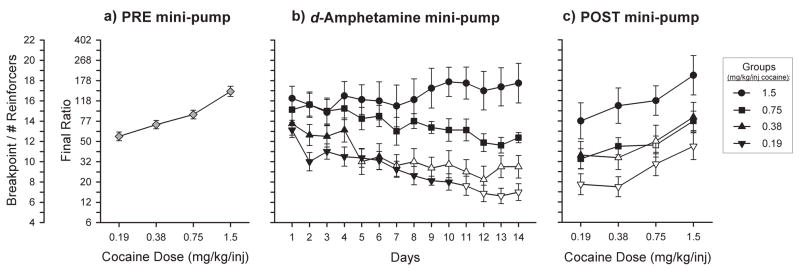
Figure 2.
Changes in the dose-response curve for self-administered cocaine after 14 days of continuous d-amphetamine (5 mg/kg/day) treatment. All points represent the mean (±SEM) breakpoints under a PR schedule. The final ratio values corresponding to breakpoints are represented on the additional y axis. a) Initial dose-response curve established in all animals (N = 32) after training sessions were completed. b) 14-day d-amphetamine treatment period during which animals were divided into four groups to self-administer one of four cocaine doses (▼: 0.19, ▲: 0.38, ■: 0.75, or ●: 1.5 mg/kg/inj). c) Final dose-response curves for each of the four groups after removal of d-amphetamine mini-pumps. Open symbols represent a significant difference from the same dose in the initial dose-response curve.

