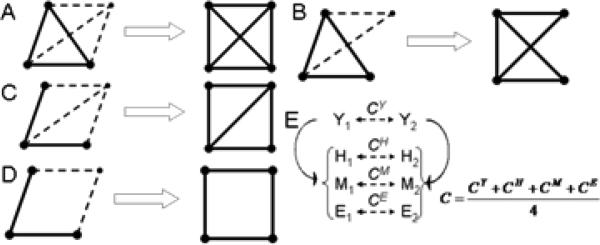
Fig. 1.
Extraction of more complex clique motifs using a progressive algorithm and enrichment of an edge (A-D, see text for explanation). (E) Enrichment of an edge in the yeast interaction network by integration of multiple species in the analysis. Solid arrows indicate orthology between proteins from yeast (Y) and other three species: human (H), mouse (M) and E. coli (E). Dashed arrows indicate the correlation coefficient between the proteins from the same species.

