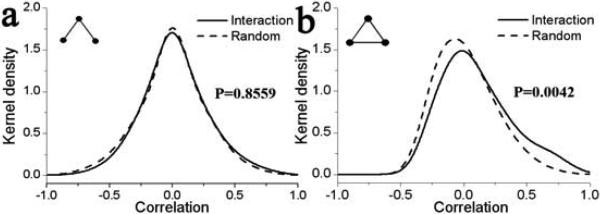
Fig. 2.
Kernel density function of expression correlation for interaction and random motifs with 3 nodes. The different motifs are shown in the left inset. P-values are indicated on the right inset for the KS-test with the null-hypothesis that the interaction and the random data come from the same underlying distributions.

