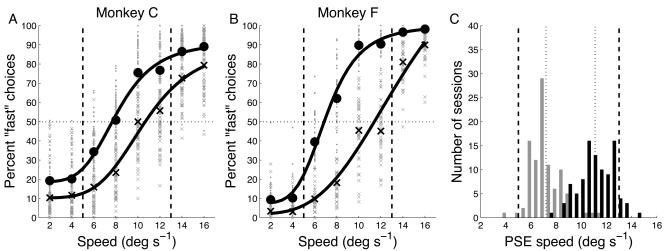
Figure 2.
Behavioral performance during the speed categorization task. A) Percentage of trials for which the stimulus speed was categorized as “fast.” Dashed vertical lines indicate category boundaries. Small symbols represent data from individual runs, sorted by boundary (slow boundary = circles, fast = x’s). Large symbols represent average performance across all runs. Solid lines represent fits of Naka-Rushton functions. B) Behavioral performance for monkey F. Same format as A. C) Distribution of PSEs from Naka-Rushton fits to session-by-session data. Dashed vertical lines are the true boundary speeds, dotted vertical lines are the means of the two PSE distributions.

