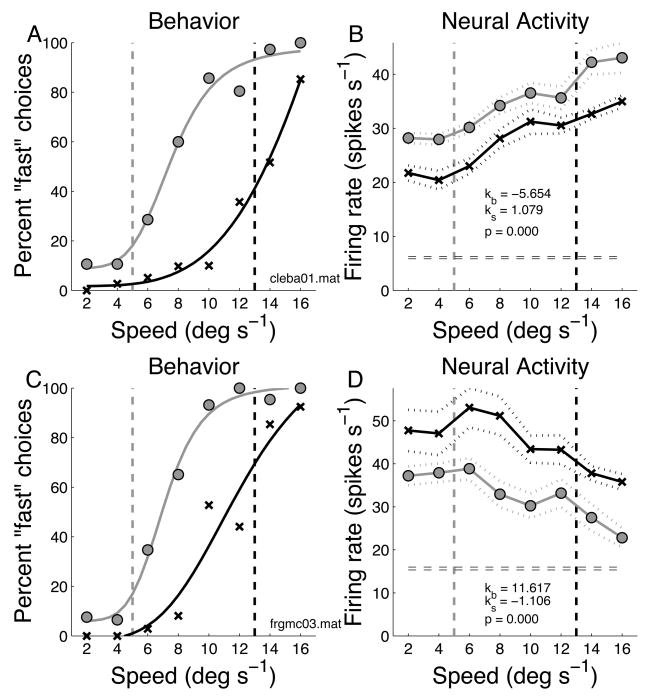
Figure 4.
Example data for two recording sessions. A) Behavioral data from one recording session. Vertical dashed lines indicate speed boundaries. Gray circles are for trials with the slower boundary, black x’s are trials with the faster boundary. Smooth curves are Naka-Rushton fits to the behavioral data. B) Response (average firing rate during decision period) of a fast-preferring FEF neuron recorded at the same time as the behavior in A. Symbols indicate the two boundary speeds as in A. Dashed lines indicate average firing rate ±1 s.e. Parameter values for the regression model are shown (kb = coefficient of boundary speed, ks = coefficient of stimulus speed, p = significance of regression model fit). C) Behavior from one session in a second monkey. D) Response of a slow-preferring neuron recorded at the same time.

