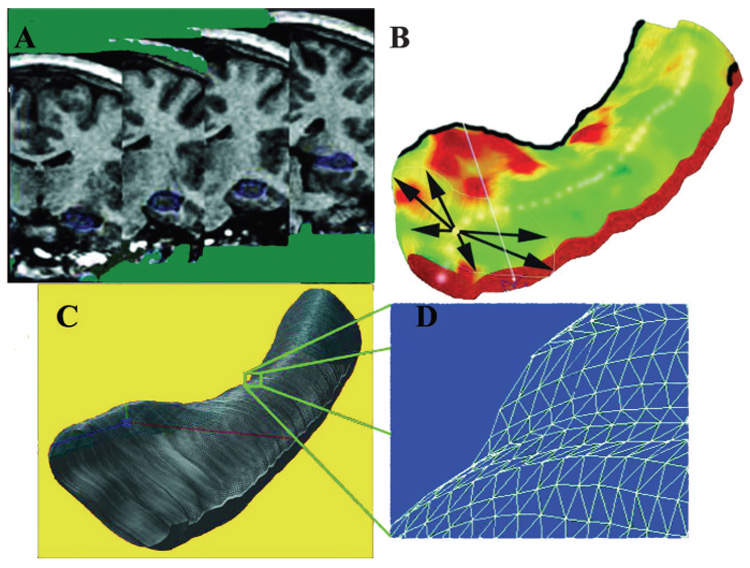
Figure 1.

Steps involved in three-dimensional hippocampal modeling. Each individual’s hippocampus is traced in consecutive coronal MRI sections (A) and converted to a three-dimensional parametric surface (B) in which the radial size of the hippocampus is measured from a centerline and plotted in color on the surface, to index radial atrophy. These meshes are averaged across subjects (C) and atrophy relative to the contralateral hippocampus in each surgical outcome group (seizure free and not seizure free) and across the two surgical outcome groups is computed at each surface grid point (D)
