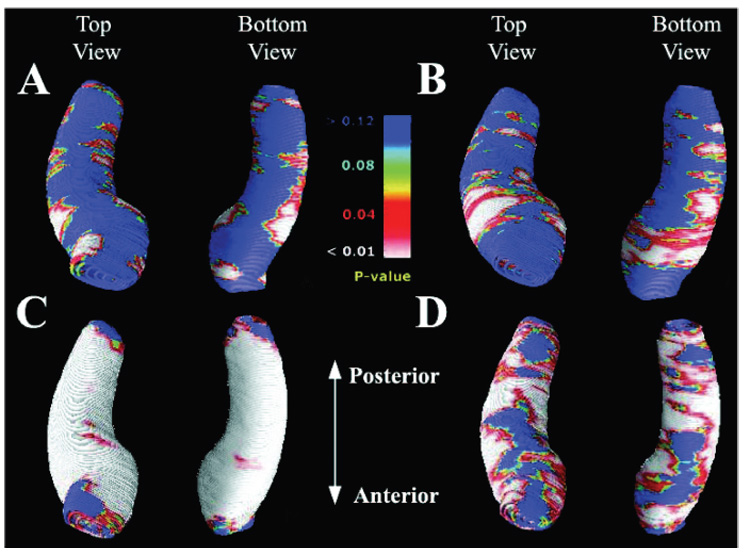
Figure 2.

Maps identifying regions where seizure-free (SF) and non– seizure-free (NSF) surgical outcome groups differ in their degree of atrophy (A and B) and regions of hippocampal asymmetry in each surgical outcome group (C and D). Group difference maps show mean hippocampal volume differences ipsilateral (A) and contralateral (B) to the side of seizure onset. Areas of significant atrophy between the two surgical outcome groups are plotted as a map of p values. The NSF groups show significantly greater diffuse atrophy in the ipsilateral hippocampus (A), whereas the contralateral side shows more region-specific atrophy pattern (B). Maximal atrophy is seen in the anterior and lateral aspects of the contralateral hippocampus. The average distribution of atrophy was computed for patients with seizure-free postsurgical outcome (C) and those who continued to have seizures (D) by directly comparing the ipsilateral to the contralateral hippocampus. Areas of significant asymmetry are visualized as a map of p values. Both SF and NSF groups showed severe diffuse deficits along the entire hippocampus. The overall asymmetry pattern suggests that the NSF group (D) had a lesser degree of asymmetry when compared with the SF group (C). However, the anterior to posterior distribution of the asymmetry pattern does not differentiate the two surgical groups.
