Figure 1.
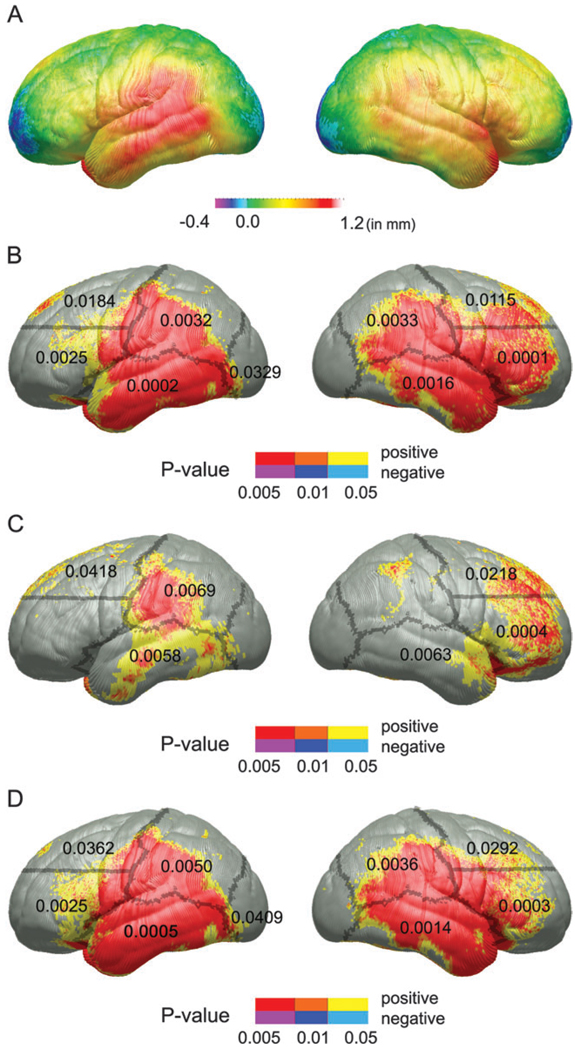
(A) FASD (PEA and FAS combined) versus control maps of the group difference in cortical thickness in millimeters according to the color bar. (B) Uncorrected P maps representing the significance of group differences in cortical thickness for the FASD versus control comparison. Positive correlations (i.e., FASD > control) are shown in hot colors, and negative correlations are shown in cool colors. There were no regions where the FASD subjects had thinner cortex than the controls. Regions in red are significant at an uncorrected P value of 0.005 or less; in orange, P values range between 0.01 and 0.005; and in yellow, P values between range between 0.05 and 0.01. (C) Uncorrected statistical P maps of the PEA versus control comparison. (D) Uncorrected tatistical P maps of the FAS versus control comparison. The color coding for (C) and (D) are identical to those described for Figure 1B. The outline of gross ROI boundaries used in permutation analyses are shown superimposed over the left and right lateral surfaces of each of the uncorrected maps, and permutation P values, where significant, are displayed within each ROI.

