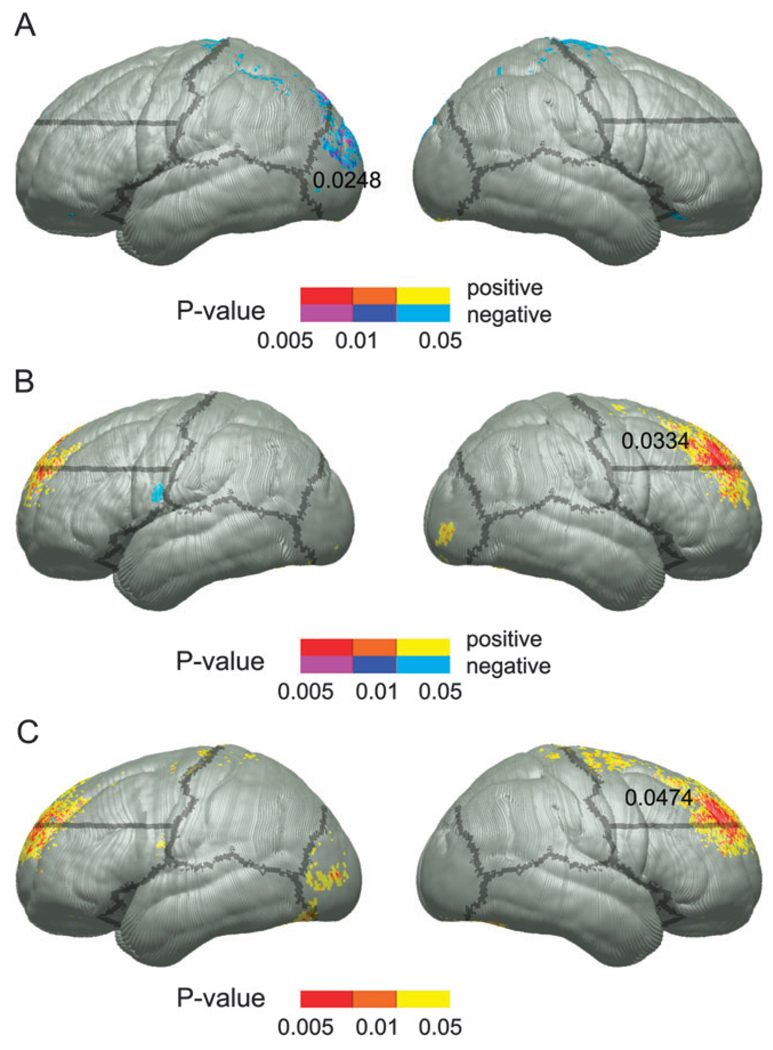
Figure 2.
Uncorrected P maps representing the significance of correlations between cortical thickness and test scores for the CVLT-C LDF measure within the control group (A) and the FASD group (B). The P values for positive and negative correlations are color coded according to the color bar with positive correlations (i.e., thinner cortex, worse performance) shown in red, orange, and yellow and negative correlations (i.e., thinner cortex, better performance) in purple, dark blue, and light blue. Statistical P maps of the interaction between group and CVLT-C LDF scores in predicting cortical thickness are shown in (C). Note that these P values were converted from F ratios in analyses of variance, thus positive and negative values are not color coded separately. Boundaries of ROIs used in permutation analyses are overlaid on the left and right surfaces, and the permutation P values, where significant, are displayed within the ROI from which they came.

