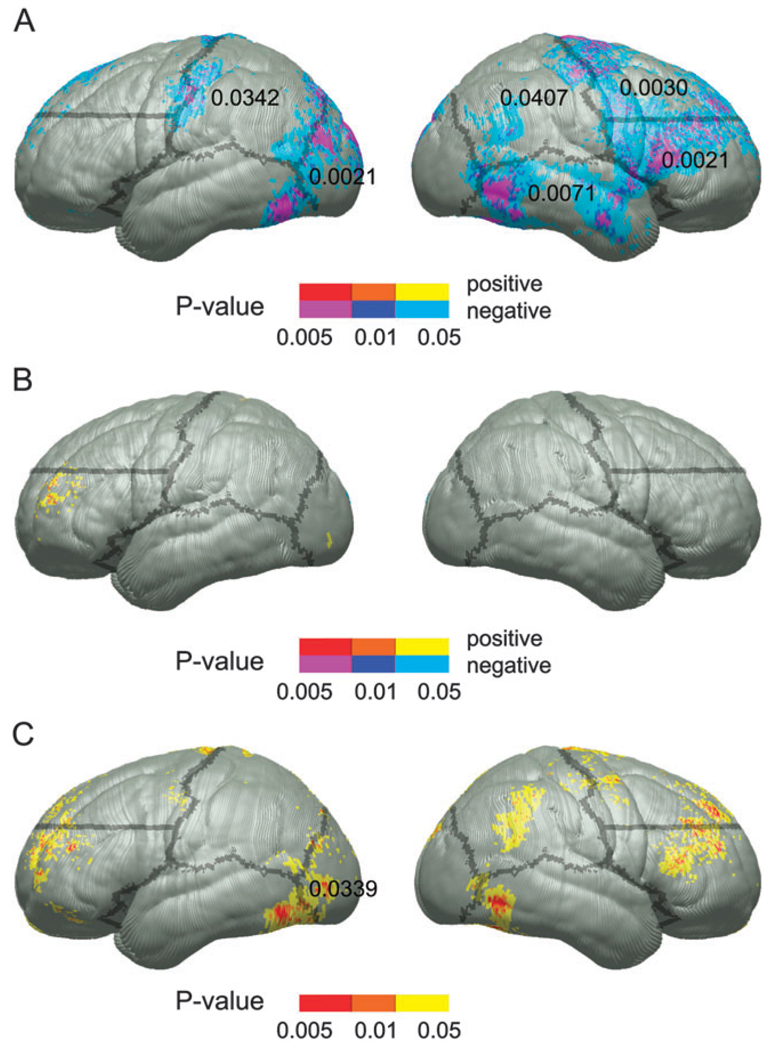
Figure 3.
The color-coding schemes are identical to those described for the CVLT-C LDF analyses described for Figure 2. Uncorrected P maps representing the significance of correlations between cortical thickness and test scores for the ROCF copy measure within the control group (A) and the FASD group (B). Statistical P maps of the interaction between group and ROCF copy scores in predicting cortical thickness are shown in (C). Note that as these P values were converted from F ratios in analyses of variance, positive and negative values are not color coded separately.

