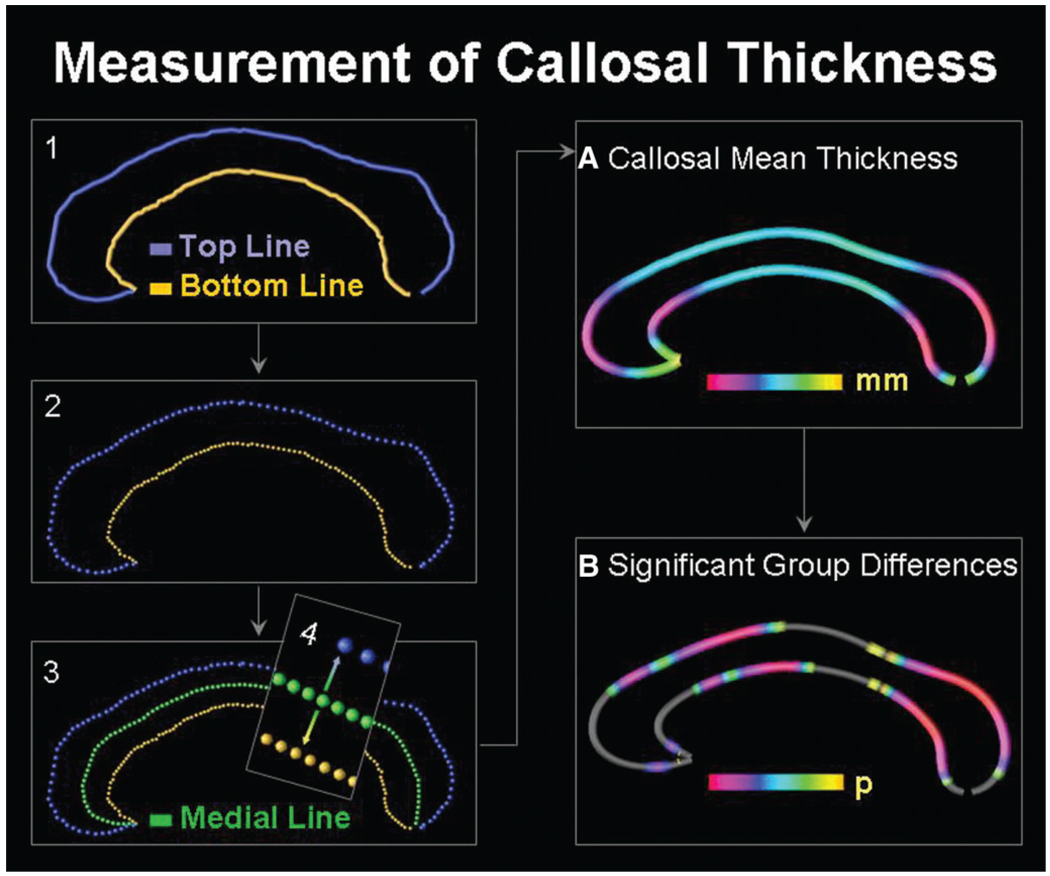
Fig. 1.
Illustration of callosal thickness measurements. Left panel: (1) After delineating upper callosal boundaries (top line) and lower callosal boundaries (bottom line), we (2) redigitized both callosal sections and (3) computed the spatial mean (medial line) between them. The (4) point-wise distances from the medial line (green) to the top line (blue) and the bottom line (yellow) were calculated. Right panel: Point-wise distance values were averaged within groups to create (A) maps of callosal mean thickness within groups and (B) maps of significant differences between groups.

