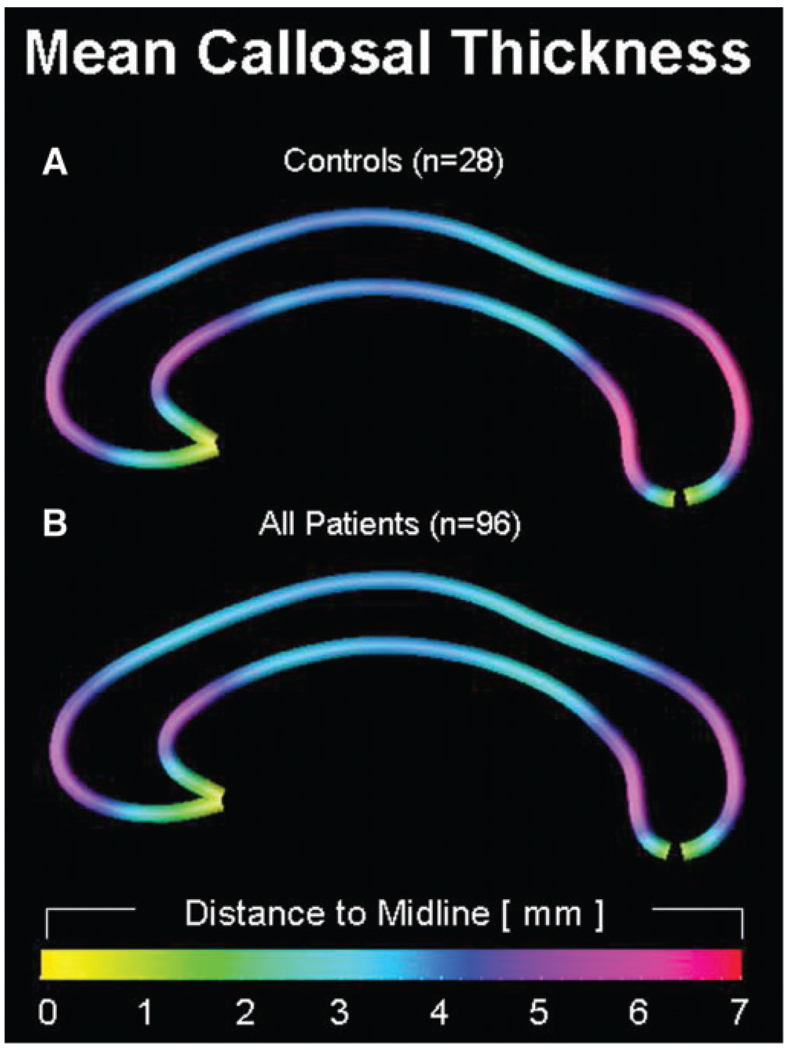
Fig. 2.
Group effects on callosal morphology. Callosal thickness profiles are displayed as colour-coded maps, illustrating the averaged point-wise distances (mm) from the medial line to the top and bottom line, within healthy controls (n = 28) and epilepsy patients (n = 96). Smaller distances correspond to a decreased callosal thickness, and larger distances correspond to an increased callosal thickness.

