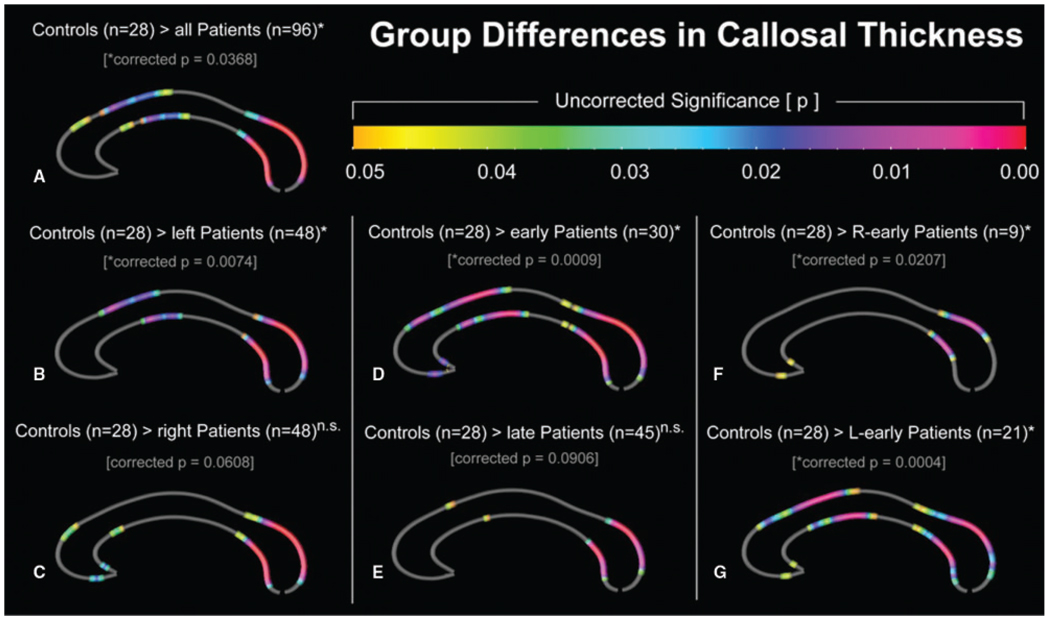
Fig. 3.
Increased callosal thickness in healthy controls compared to epilepsy patients (Controls > Patients): (A) all patients; (B) patients with left temporal lobe epilepsy (left patients); (C) patients with right temporal lobe epilepsy (right patients); (D) patients with early onset temporal lobe epilepsy (early); (E) patients with late onset temporal lobe epilepsy (late); (F) patients with early onset right temporal lobe epilepsy (R-early), and (G) patients with early onset left temporal lobe epilepsy (L-early). The colour bar encodes the uncorrected P-value associated with the t-test performed at each distance value from upper and lower callosal boundaries. The asterisks indicate results that were confirmed by permutation testing (n.s. is non-significant).

