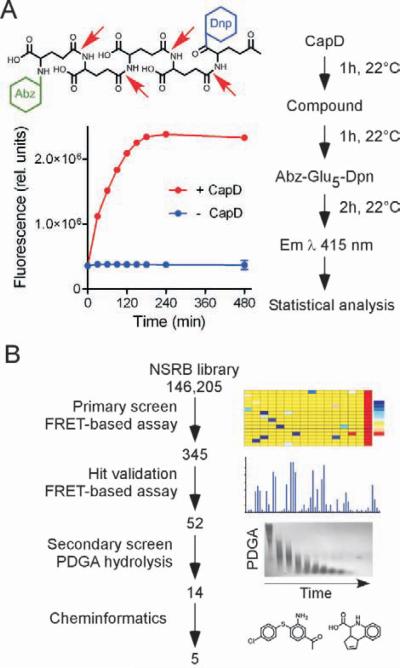
Fig. 4. High-throughput screening for CapD inhibitors.
A. CapD-mediated cleavage of FRET-substrate Abz-γ-D-Glu5-Dnp (red arrows) is monitored as fluorescence emission at 415 nm (saturation kinetics). The order of addition of reactants and incubation times are displayed on the flow chart and were optimized by performing a pilot screen with 9216 compounds.
B. Flow chart of assays used for hit validation. The primary screen used the FRET-based assay performed in a 384-well format followed by single sample measurement (Hit validation of FRET-based assay). The secondary screen used CapD-mediated cleavage of PDGA analyzed by agarose gel electrophoresis and methylene blue staining of capsular material.

