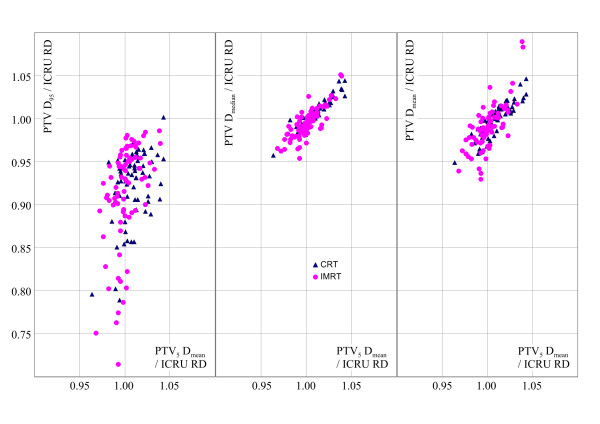
Figure 2.
Correlation of several prescription and reporting methods (all related to ICRU RD, the mean value of 4 or 5 points fulfilling the ICRU 52/60 Reference Dose criteria) with the ratio of the prescriptions PTV5 Dmean/ICRU RD (PTV5 Dmean: mean dose for the central part of the PTV). Results for all plans of the study. All methods report for the same dose distribution per study. Circles: All IMRT plans and related volumes. Triangles: All CRT plans used in this study. left: PTV5Dmean vs. PTV D95 (dose to 95% of the PTV). middle: PTV5Dmean vs. PTV Dmedian. (median dose for the PTV) right: PTV5Dmean vs. PTV Dmean (mean dose of the PTV).

