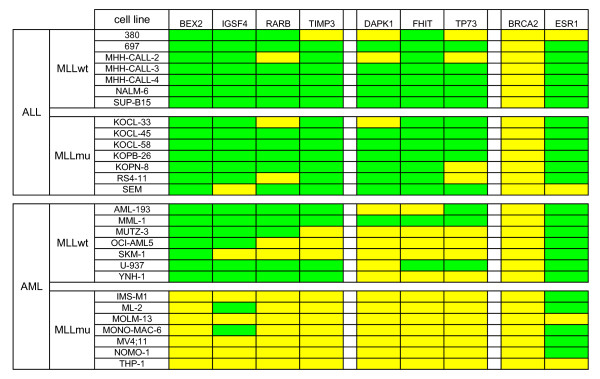
Figure 2.
TSG methylation predictive for classification of acute leukemia cell lines. Methylation was assessed by MS-MLPA (see also Additional file 1) or by DNA digestion with methylation-sensitive HhaI plus promoter-specific quantitative real-time PCR (for analysis of BEX2). Green: methylation level ≥ 10%; yellow: methylation level < 10%. BEX2, IGSF4, RARB and TIMP3 are methylated in ALL and in MLLwt AML, but not in MLLmu AML. This correlation is statistically significant with p-values < 0.05 for BEX2, RARB and TIMP3 and with a p-value of 0.051 for IGSF4 (Fisher's exact test). Methylation analysis of DAPK1, FHIT and TP73 discriminates between ALL and AML cell lines (p-values ≤ 0.01, Fisher's exact test). Other TSG (e.g. BRCA2 and ESR1) are methylated or unmethylated in the majority of cell lines with no preference for subtype.

