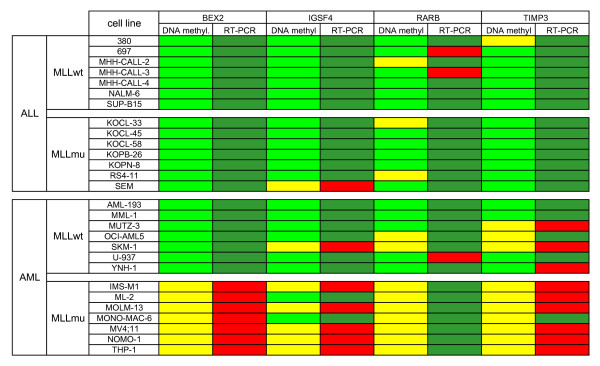
Figure 5.
Inverse correlation between TSG methylation and expression. Hypomethylation (yellow) parallels RNA expression (red) of BEX2, IGSF4 and TIMP3 in MLLmu AML. MLLwt AML cell lines show hypermethylation (light green) and transcriptional silencing (green) of these. In contrast, RARB expression is low (green) even in cell lines that carry the unmethylated promoter (yellow). Excluding RARB, TSG hypermethylation inversely correlated with gene transcription in 94% of the cases. TSG methylation status is shown as determined by MS-MLPA (see Additional file 1). Gene expression was assessed in triplicates by quantitative real-time PCR (RT-PCR) analysis. For BEX2, IGSF4 and TIMP3, cell line IMS-M1 was applied as calibrator; for RARB, expression levels in cell line 697 were set as 1. Cell lines that reached relative expression levels ≥ 0.05 were considered positive (red).

