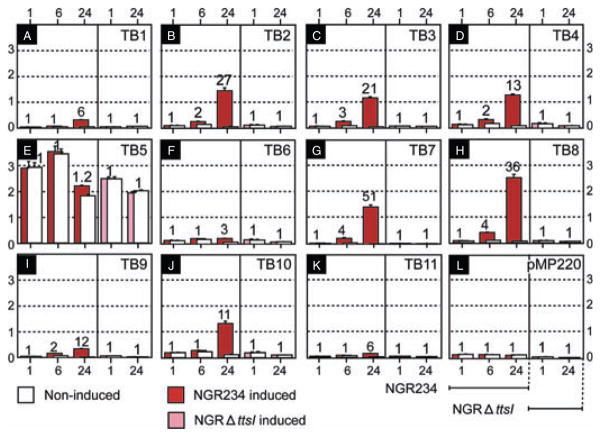
Fig. 2.
Expression analyses of TBs in pNGR234a. Flavonoid inducibility of TBs in the wild-type and NGRΔttsI backgrounds. A–L represent the levels of β-galactosidase activity (× 103 Miller’s units). Activity of the vector pMP220 devoid of an insert is reported in L. Assays were performed 1, 6 and 24 hpi with 2 × 10⁻⁷ M daidzein. In the absence of an inducer, basal levels of β-galactosidase activity are shown as open bars. Values obtained with induced transconjugants are coded as: NGR234 (red bars); NGRΔttsI (pink bars). The values reported represent the means of three independent experiments. Error bars are shown on top of each column. Numbers on top of each bar represent the relative increase in activity of induced- as compared with non-induced cultures.

